March 2004
Song Audio
SA-300 MB Mono Amplifiers: Measurements
All amplifier measurements are performed
independently by BHK Labs. Please click to learn
more about how we test amplifiers there. All measurement data and graphical
information displayed below are the property of SoundStage! and Schneider
Publishing Inc. Reproduction in any format is not permitted.
- Measurements were made with 120V AC line voltage, using the
8-ohm output terminals, and with one channel driven (this is a mono amplifier).
- Gain: 7.5x, 17.5dB.
- Output noise, 8-ohm load, unbalanced input, 1k-ohm input
termination: wideband 1.64mV, -64.7dBW; A weighted 0.257mV, -80.8dBW.
- AC line current draw at idle: 0.64A.
- Output impedance at 50Hz: 5.6 ohms.
- This amplifier does not invert polarity.
Power output with 1kHz test signal
- 16-ohm load at 1% THD: 6.0W
- 16-ohm load at 10% THD: 9.7W
- 8-ohm load at 1% THD: 1.6W
- 8-ohm load at 10% THD: 9.0W
- 4-ohm load at 1% THD: 0.35W
- 4-ohm load at 10% THD: 5W
General
The Song Audio SA-300 MB single-ended triode amplifier has
notably low AC power consumption for an amp that can put out more than 5W. This amp came
with the output tube bias set somewhat lower than recommended -- about 0.45V instead of
0.65V. Setting up the bias to the correct value made a major improvement in distortion
performance.
Frequency response, as seen in Chart 1, rolls off at both
ends of the audio range with a nicely controlled high-frequency roll-off characteristic.
The low-frequency response holds up down to 20Hz -- better than many of the low-/no-
feedback SET designs. Output impedance is rather high, giving an approximate +/-3dB
frequency-response variation on the NHT dummy-speaker load. Total harmonic distortion plus
noise for a test frequency of 1kHz and SMPTE IM distortion as a function of power output
and load is plotted in Chart 2. The chart shows that the amount of distortion at the 1kHz
test frequency is reasonably low at less than 2% up to 3.3W output for the 8-ohm load.
Total harmonic distortion plus noise as a function of frequency at several power levels is
plotted in Chart 3 for 8-ohm loading. Amount of distortion over the main midrange energy
band is about 1% or less for power outputs of up to about 2W. Notable here is the total
absence of the usual rise of distortion at the higher frequencies. However, distortion
does rise considerably at the low end of the audio range, as is typical for SE tube
designs. Damping factor versus frequency shown in Chart 4 is about 1.4 over most of the
frequency range. In the spectral plot of distortion and noise for a 5W 1kHz signal into an
8-ohm load as plotted in Chart 5, the signal harmonics decay uniformly which is said to
make for a "musical-sounding" amplifier. The amount of AC line hum components
adding up to about 1.6mV would likely be audible on speakers with efficiencies of 90dB or
more.
| Chart 1
- Frequency Response of Output Voltage as a Function of Output Loading |
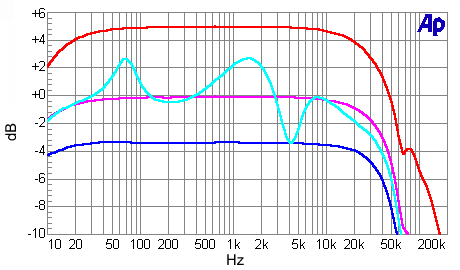
Red line: open circuit
Magenta line: 8-ohm load
Blue line: 4-ohm load
Cyan line: NHT dummy-speaker load
| Chart 2 - Distortion as a Function
of Power Output and Output Loading |
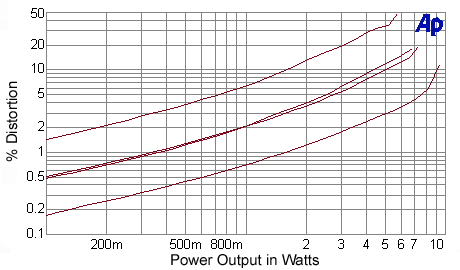
(line up at 5W to determine lines)
Top line: 4-ohm SMPTE IM
Second line: 8-ohm SMPTE IM
Third line: 4-ohm THD+N
Bottom line: 8-ohm THD+N
| Chart 3 - Distortion
as a Function of Power Output and Frequency |
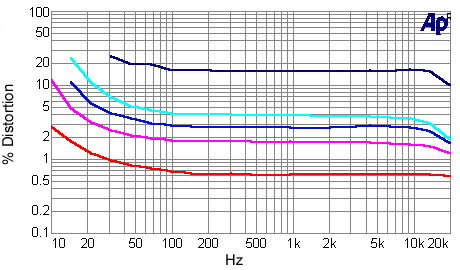
8-ohm output loading
Dark-blue line: 10W
Cyan line: 7W
Blue line: 5W
Magenta line: 3W
Red line: 1W
| Chart 4 - Damping Factor
as a Function of Frequency |
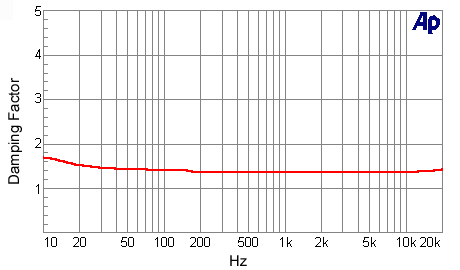
Damping factor = output impedance divided into 8
| Chart 5 - Distortion and
Noise Spectrum |
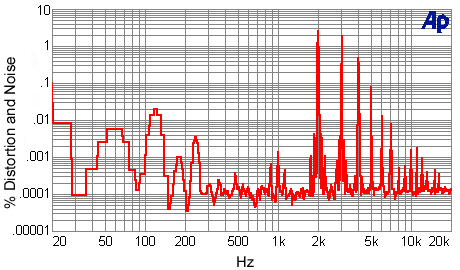
1kHz signal at 10W into an 8-ohm load
|
![[SoundStage!]](../titles/sslogo3.gif) Home Audio
Home Audio ![[SoundStage!]](../titles/sslogo3.gif) All Contents
All Contents


