May 2002
Opera Audio M800
Mono Amplifiers: Measurements
All amplifier measurements are performed
independently by BHK Labs. Please click to learn
more about how we test amplifiers there. All measurement data and graphical
information displayed below are the property of SoundStage! and Schneider
Publishing Inc. Reproduction in any format is not permitted.
- Amplifier was measured in both Ultralinear and Triode modes
of operation.
- Measurements were made with 120V AC line voltage.
- Power output plotted with one channel driven (this is a mono
amplifier).
- Output tube plate current set to 35mA.
- Gain, triode/ultralinear: 24.2x, 27.7dB/28.5x, 29.1dB.
- Output noise, 8-ohm load
- Ultralinear: wideband 0.48mV, -75.4dBW; A weighted 0.145mV,
-85.8dBW.
- Triode: wideband 0.445mV, -76.1dBW; A weighted 0.135mV,
-86.4dBW.
- AC line current draw at idle: 1.25A.
- Output impedance
- Ultralinear: 2.1 ohms.
- Triode: 1.4 ohms.
- This amplifier does not invert polarity.
Power output with 1kHz test signal (triode)
- 8-ohm load at 1% THD: 13W
- 8-ohm load at 10% THD: 40W
- 4-ohm load at 1% THD: 4W
- 4-ohm load at 10% THD: 43W
- 16-ohm load at 1% THD: 19W
- 16-ohm load at 10% THD: 32W
Power output with 1kHz test signal (ultralinear)
- 8-ohm load at 1% THD: 3.7W
- 8-ohm load at 10% THD: 70W
- 4-ohm load at 1% THD: 0.9W
- 4-ohm load at 10% THD: 72W
- 16-ohm load at 1% THD: 15W
- 16-ohm load at 10% THD: 32W
General
Chart 1 shows that this amplifier has a relatively wide
bandwidth in excess of 10Hz-100kHz. However, like many tube amplifiers, the output
regulation is not too good due to the relatively high output impedance -- shown by the
drop in level from open circuit to 4-ohm loading. The "Triode" mode has lower
output impedance and, therefore, better output regulation. Chart 2 shows that the
"Triode" mode has lower distortion than the "Ultralinear" mode, but
with about half the power available. Power output and distortion are best with the rated
load on either of the output taps. With a load of half of the rated value, the power
output is about the same, but at higher distortion. With a load of twice the rated value,
distortion is lower but so is output power. This amp can deliver about 35W in
"Triode" mode and 60W in "Ultralinear" mode at about 2-3% distortion
over most of the audio range into the rated load. Chart 3, which shows distortion versus
frequency, shows the "Triode" mode as having the lowest distortion, and
unusually and desirably, the distortion amount is fairly constant with frequency. However,
in the "Ultralinear" mode, the distortion at low frequencies rises quite a bit
at low frequencies. Damping factor in the two modes is illustrated in Chart 4 with the
"Triode" mode having the highest damping factor (lowest output impedance). In
Chart 5, the higher harmonics are lower in the triode mode.
| Chart 1
- Frequency Response of Output Voltage as a Function of Output Loading |
Triode mode with data
taken on the 8-ohm tap
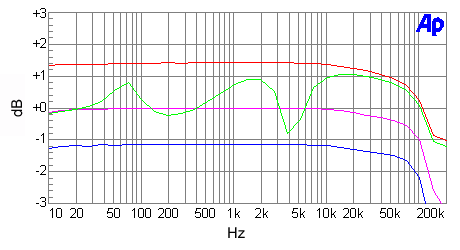
Red line: open circuit
Green line: dummy speaker load
Magenta line: 8-ohm load
Blue line: 4-ohm load
Ultralinear mode with data taken on
the 8-ohm tap
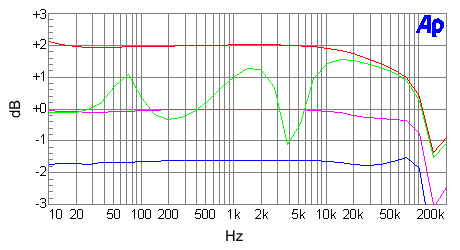
Red line: open circuit
Green line: dummy speaker load
Magenta line: 8-ohm load
Blue line: 4-ohm load
| Chart 2 - Distortion as a Function
of Power Output and Output Loading |
Triode mode with data
taken on the 8-ohm tap
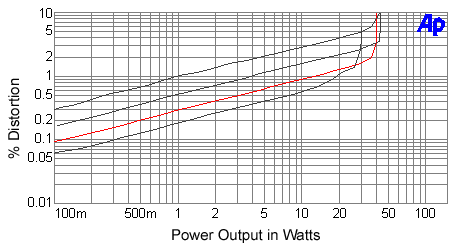
Top line: 8-ohm SMPTE IM
Second line: 4-ohm THD+N
Third line (red): 8-ohm THD+N
Bottom line: 16-ohm THD+N
Ultralinear mode with data taken on
the 8-ohm tap
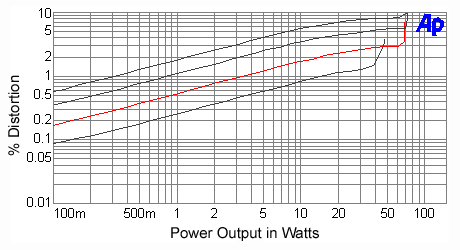
Top line: 8-ohm SMPTE IM
Second line: 4-ohm THD+N
Third line (red): 8-ohm THD+N
Bottom line: 16-ohm THD+N
| Chart 3 - Distortion
as a Function of Power Output and Frequency |
Triode mode with data
taken on the 8-ohm tap
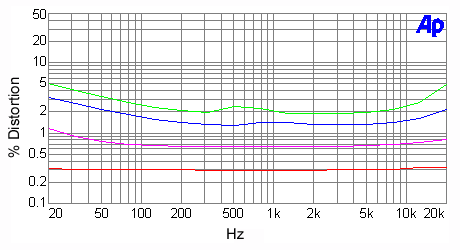
8-ohm output loading
Green line: 35W
Blue line: 20W
Magenta line: 5W
Red line: 1W
Ultralinear mode with data taken on
the 8-ohm tap
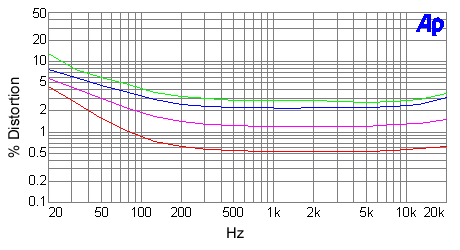
8-ohm output loading
Green line: 35W
Blue line: 20W
Magenta line: 5W
Red line: 1W
| Chart 4 - Damping Factor
as a Function of Frequency |
Triode and
Ultralinear modes both plotted
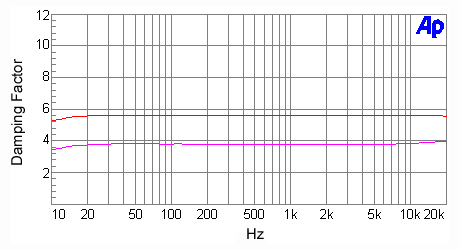
Damping factor = output impedance divided into 8
Red line: Triode
Magenta line: Ultralinear
| Chart 5 - Distortion and
Noise Spectrum |
Triode mode with data
taken on the 8-ohm tap
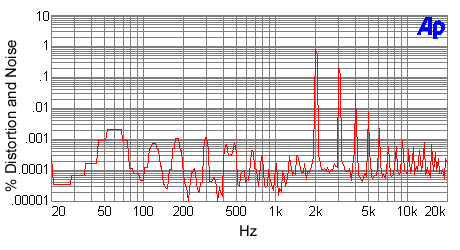
1kHz signal at 10W into an 8-ohm load
Ultralinear mode with data taken on
the 8-ohm tap

1kHz signal at 10W into an 8-ohm load
|
![[SoundStage!]](../titles/sslogo3.gif) Home Audio
Home Audio ![[SoundStage!]](../titles/sslogo3.gif) All Contents
All Contents


