August 2004
Lamm Industries
M1.2 Reference Mono Amplifiers: Measurements
All amplifier measurements are performed
independently by BHK Labs. Please click to learn
more about how we test amplifiers there. All measurement data, including graphical
information displayed below, is the property of SoundStage!. Reproduction in any
format is not permitted.
- Measurements were made with 120V AC line voltage.
- Power output and distortion plotted with one channel driven
(this is a mono amplifier).
- Output noise, 8-ohm load, unbalanced input, 1k-ohm input
termination: wideband 1.12mV, -68.1dBW; A weighted 0.483mV, -75.4dBW.
- AC line current draw at idle: 4.2A (warmed-up).
- Output impedance at 50Hz: 0.08 ohms.
- This amplifier does not invert polarity.
Power output with 1kHz test signal
- 8-ohm load at 1% THD: 157W
- 4-ohm load at 1% THD: 300W
General
Measurements were made feeding the
unbalanced inputs with the -phase RCA jack shorted. Results were substantially the same
through the balanced inputs. Chart 1 shows the frequency response of the amp with varying
loads. As can be seen, the output impedance, as judged by the closeness of spacing between
the curves of open circuit, 8-ohm and 4-ohm loading, is quite low. The variation with the
NHT dummy load is less than +/- 0.1dB, not of great consequence. Chart 2 illustrates how
total harmonic distortion plus noise vs. power varies for a 1kHz and SMPTE IM test signals
and amplifier output load. As can be seen, attainable power is greater for the 4-ohm load
as is usual for most power amplifiers. Total harmonic distortion plus noise as a function
of frequency at several different power levels is plotted in Chart 3. The amount of rise
in distortion at high frequencies is quite low, a desirable characteristic, and a
particular characteristic that designer Vladimar Lamm feels is important. Damping factor
vs. frequency is shown in Chart 4. Notable about this curve is how constant the damping
factor is with frequency, a property that usually goes along with constant distortion vs.
frequency. A spectrum of the harmonic distortion and noise residue is plotted in Chart 5.
The AC line harmonics are relatively high in this Chart. The signal harmonics are
basically second and third with higher harmonics being less than the noise floor. Also,
there are no 120Hz modulation sidebands around the nulled fundamental 1kHz test frequency
or its harmonics.
| Chart 1
- Frequency Response of Output Voltage as a Function of Output Loading |
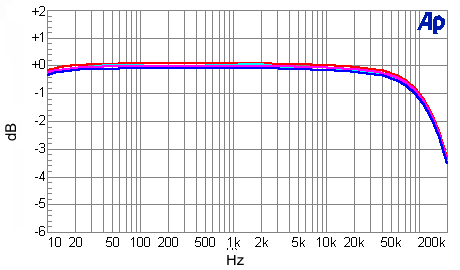
Magenta line: open circuit
Red line: 8-ohm load
Blue line: 4-ohm load
Cyan line: NHT dummy-speaker load
| Chart 2 - Distortion as a Function
of Power Output and Output Loading |
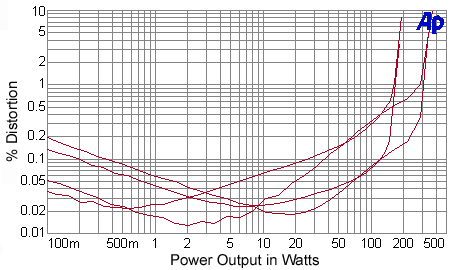
(line up at 20W to determine lines)
Top line: 8-ohm SMPTE IM
Second line: 4-ohm SMPTE IM
Third line: 8-ohm THD+N
Bottom line: 4-ohm THD+N
| Chart 3 - Distortion
as a Function of Power Output and Frequency |
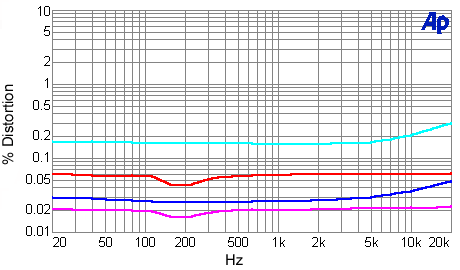
4-ohm output loading
Cyan line: 200W
Blue line: 50W
Magenta line: 10W
Red line: 1W
| Chart 4 - Damping Factor
as a Function of Frequency |
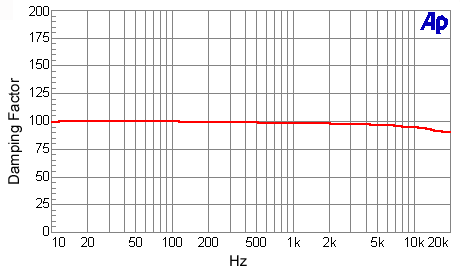
Damping factor = output impedance divided into 8
| Chart 5 - Distortion and
Noise Spectrum |
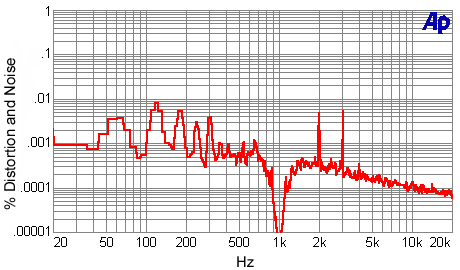
1kHz signal at 10W into an 4-ohm load
|
![[SoundStage!]](../titles/sslogo3.gif) Home Audio
Home Audio